Analysis Widget
Analysis widget
The analysis widget makes the Adhoc analysis reports visible in the dashboard. By adding the analysis widget and selecting the report user can see the adhoc report in the dashboard.
If user creates the report from analysis widget, it saved at the ad hoc analysis section.
Skill Level Required
- Should know how to make dashboard.
Steps to Create a analysis widget
- Find the Analysis icon from the right vertical menubar, click on the Marketplace icon, as shown in the figure below:
- Once the widget appear in the dashboard, click on the dataset icon to fetch the dataset in analysis widget, as shown in the figure below:
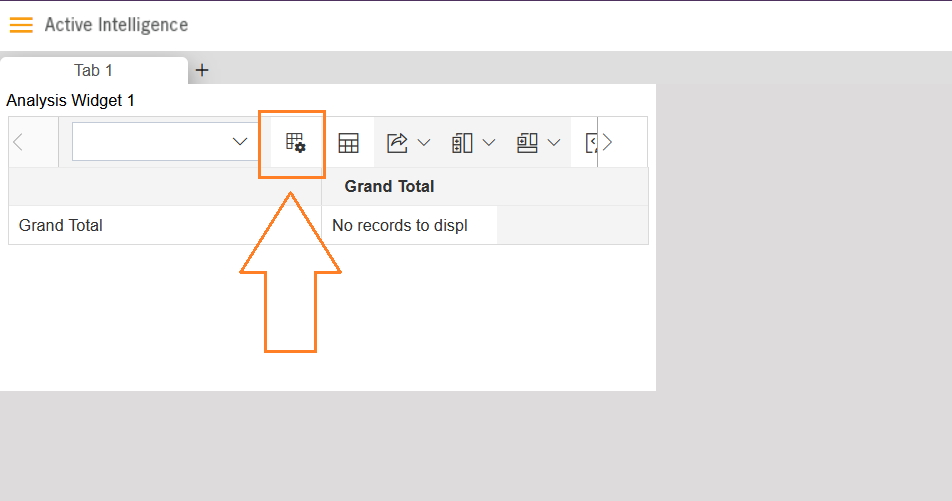
- As you click on the dataset icon, the dataset dialogbox appear in the dashboard, now select the rows,columns and Values.
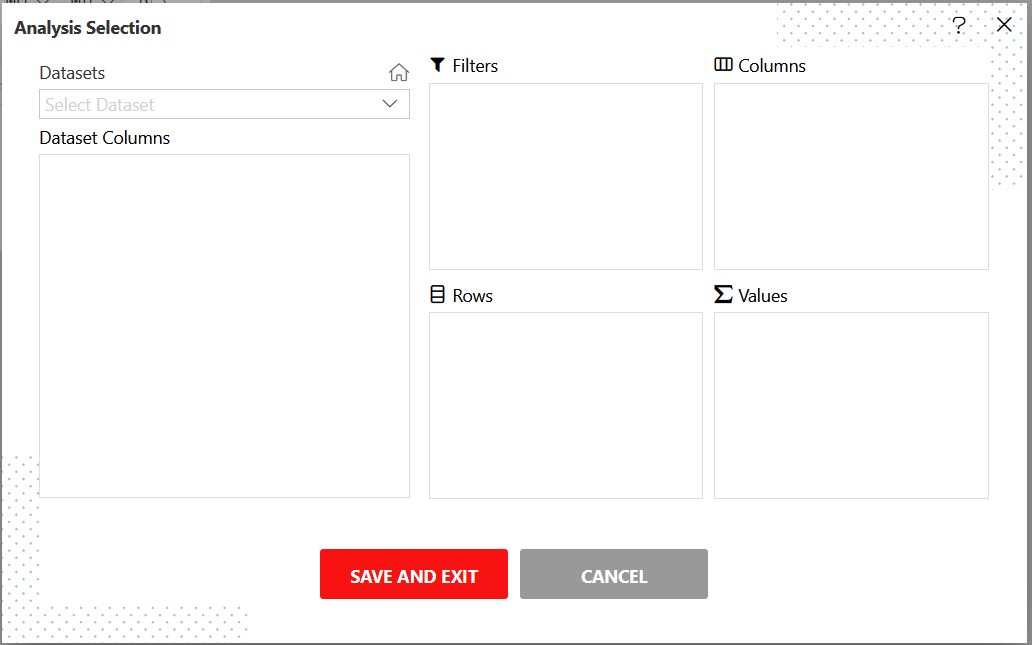
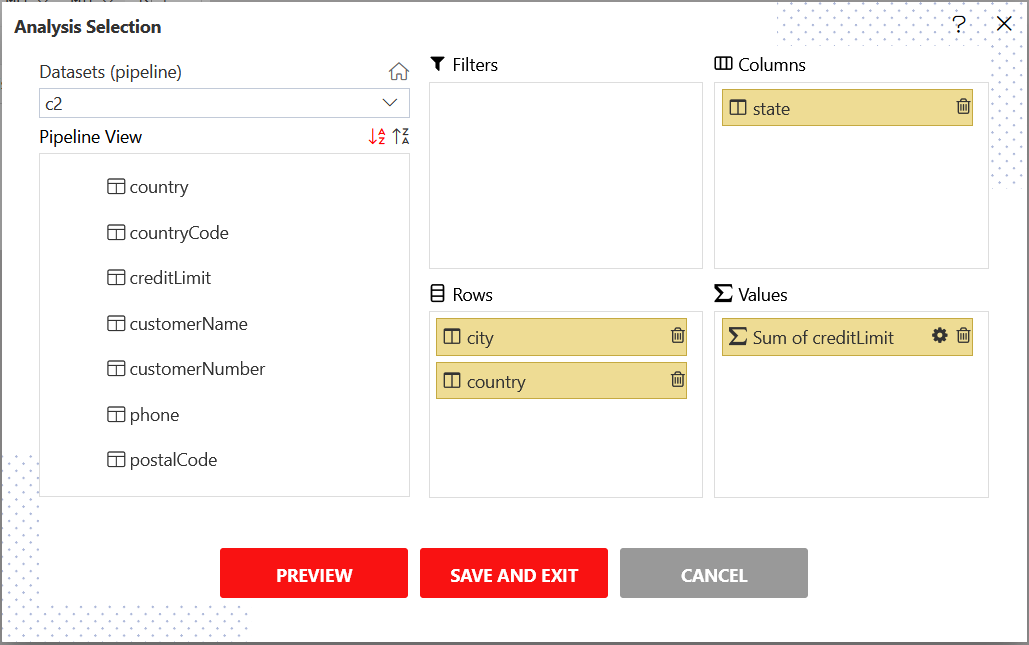
- After selecting the Rows,Columns and Values in the dataset.
info
In the above figure, we have used the .pds dataset made from the pipeline dataset.
click on preview button then click on save & Exit button.
From Save As dialog box, add name and click on the SAVE AS button. you will able to see the saved analysis from the Adhoc Analysis section under the masterdata.
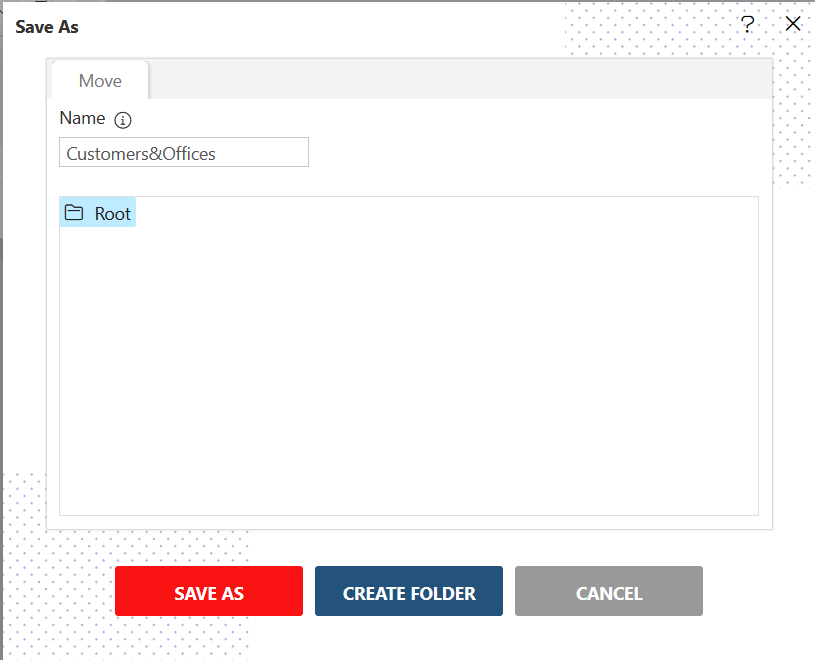
Click on Save as button to save the analysis.
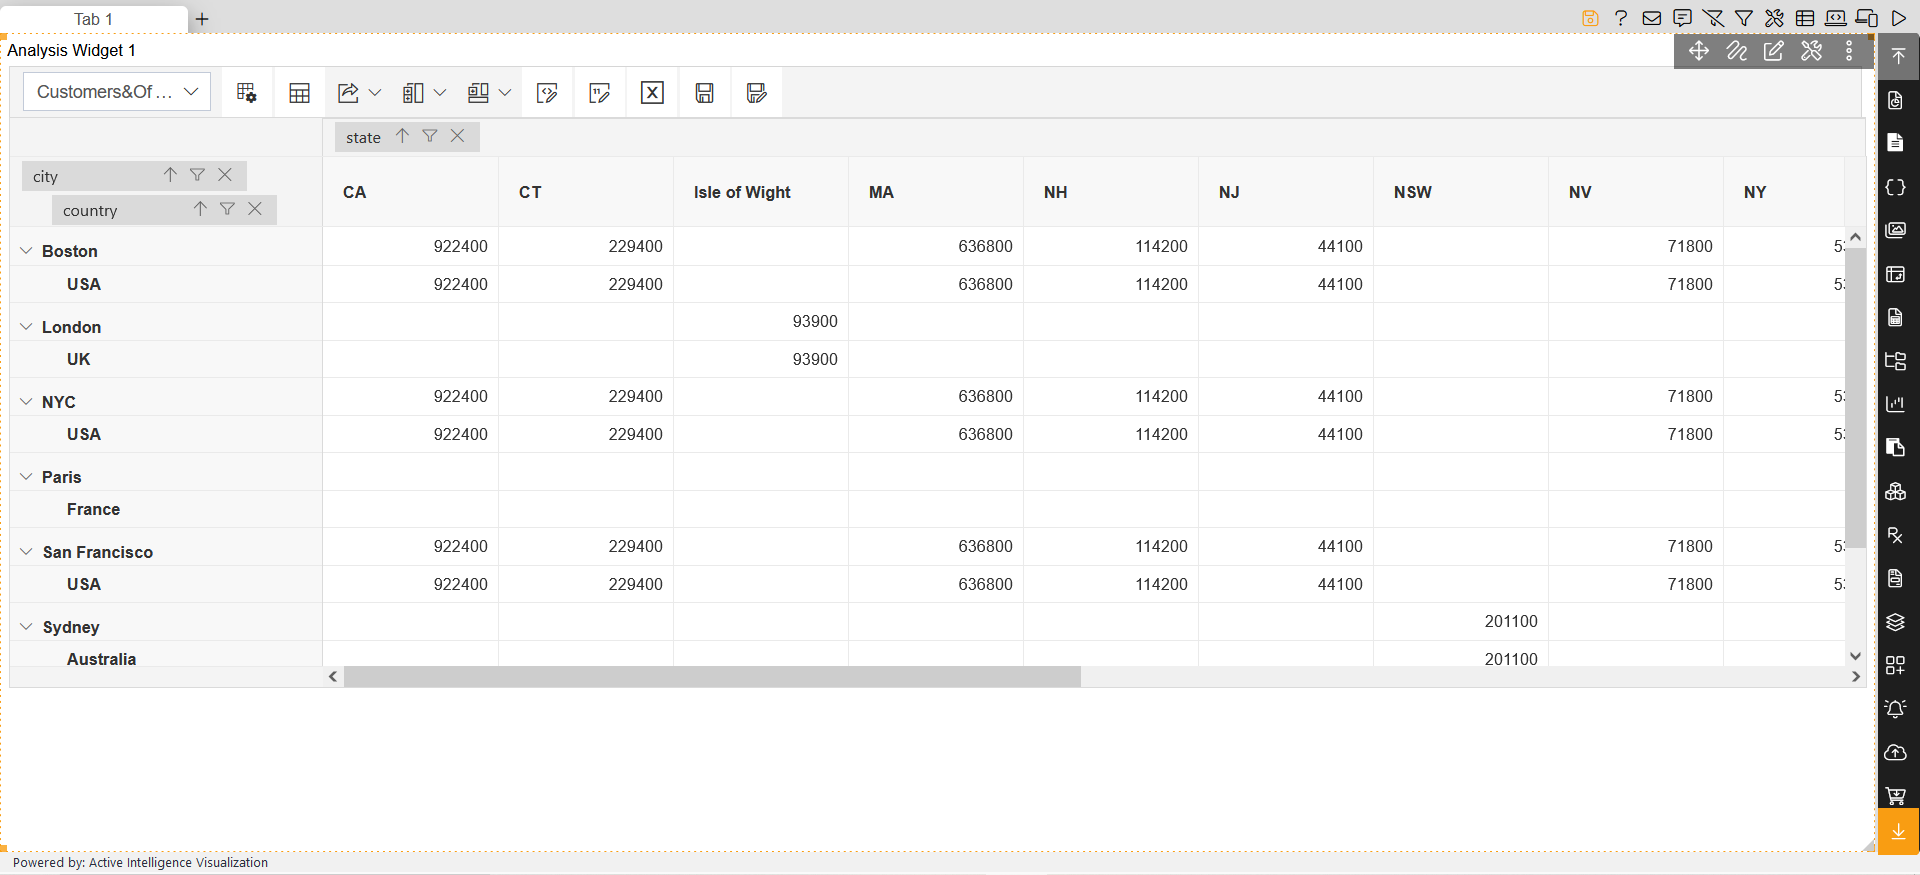
The example analysis widget below:
Analysis
Tables
Charts
Maps
Reports
KPI
Custom Visualization
Image and Text
Pivot
OLAP
Note Book
Form Builder
Dynamic view
Layers
Alerts
Scratch Pad
Section/Blank
Filter
Dynamic Linking
Embed Dashboard
Predictions in AIV
External Apps
File Manager
Marketplace
Multi Layer Widget
Marketplace
✒️ To know more about advance feature of Dashboard Widgets click on below links:-